使用R模拟网络扩散
与普通的扩散研究不同,网络扩散开始考虑网络结构对于扩散过程的影响。
这里介绍一个使用R模拟网络扩散的例子。基本的算法非常简单:
- 生成一个网络:g(V, E)。
- 随机选择一个或几个节点作为种子(seeds)。
- 每个感染者以概率p(可视作该节点的传染能力,通常表示为$\beta$)影响与其相连的节点。
其实这是一个最简单的SI模型在网络中的实现。S表示可感染(susceptible), I表示被感染(infected)。SI模型描述了个体的状态从S到I之间的转变。因为形式简单,SI模型是可以求出其解析解的。考虑一个封闭的群体,没有出生、死亡和迁移。并假设个体是均匀混合的(homogeneous mixing),也就是要求个体的地理分布均匀,且被感染的概率也相同(T. G. Lewis, 2011)。那么β表示传染率(transmission rate)。SI模型可以表达为:
\[\frac{dS}{dt}=-\beta SI\] \[\frac{dI}{dt}=\beta SI\]且满足 I + S = 1,那么以上方程\(\frac{dI}{dt}=\beta SI\)可以表达为:
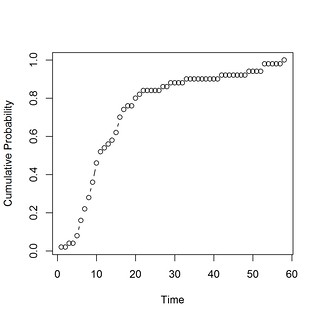
\[\frac{dI}{dt}=\beta I(1-I)\]解这个微分方程,我们可以得到累计增长曲线的表达式。有趣的是,这是一个logistic增长,具有明显的S型曲线(S-shaped curve)特征。该模型在初期跨越临界点之后增长较快,后期则变得缓慢。 因而可以用来描述和拟合创新扩散过程(diffusion of innovations)。
当然,对疾病传播而言,SI模型是非常初级的(naive),主要因为受感染的个体以一定的概率恢复健康,或者继续进入可以被感染状态(S,据此扩展为SIS模型)或者转为免疫状态(R,据此扩展为SIR模型)。 免疫表示为R,用$\gamma$代表免疫概率(removal or recovery rate)。对于信息扩散而言,这种考虑暂时是不需要的。
第一步,生成网络。
require(igraph)
# generate a social graph
size = 50

# 规则网
g = graph.tree(size, children = 2); plot(g)
g = graph.star(size); plot(g)
g = graph.full(size); plot(g)
g = graph.ring(size); plot(g)
g = connect.neighborhood(graph.ring(size), 2); plot(g) # 最近邻耦合网络

# 随机网络
g = erdos.renyi.game(size, 0.1)

# 小世界网络
g = rewire.edges(erdos.renyi.game(size, 0.1), prob = 0.8 )
# 无标度网络
g = barabasi.game(size) ; plot(g)
第二步,随机选取一个或n个种子。
#  initiate the diffusers
seeds_num = 1
set.seed(2014); diffusers = sample(V(g),seeds_num) ; diffusers
infected =list()
infected[[1]]= diffusers
第三步,在这个简单的例子中,每个节点的传染能力是0.5,即与其相连的节点以0.5的概率被其感染。在R中的实现是通过抛硬币的方式来实现的。
# for example, set percolation probability = 0.5
coins = c(0,1)
n = length(coins)
sample(coins, 1, replace=TRUE, prob=rep(1/n, n))
显然,这很容易扩展到更一般的情况,比如节点的平均感染能力是0.128,那么可以这么写:
p = 0.128
coins = c(rep(1, p*1000), rep(0,(1-p)*1000))
n = length(coins)
sample(coins, 1, replace=TRUE, prob=rep(1/n, n))
当然最重要的一步是要能按照“时间”更新网络节点被感染的信息。
# function for updating the diffusers
update_diffusers = function(diffusers){
  nearest_neighbors = neighborhood(g, 1, diffusers)
  nearest_neighbors = data.frame(table(unlist(nearest_neighbors)))
  nearest_neighbors = subset(nearest_neighbors, !(nearest_neighbors[,1]%in%diffusers))
  # toss the coins
  toss = function(freq) {
	tossing = NULL
	for (i in 1:freq ) tossing[i] = sample(coins, 1, replace=TRUE, prob=rep(1/n, times=n))
	tossing = sum(tossing)
	return (tossing)
  }
  keep = unlist(lapply(nearest_neighbors[,2], toss))
  new_infected = as.numeric(as.character(nearest_neighbors[,1][keep >= 1]))
  diffusers = unique(c(diffusers, new_infected))
  return(diffusers)
  }
完成了以上三步。准备好了吗,现在开始开启扩散过程!
## Start the contagion!
i = 1
while(length(infected[[i]]) < size){
  infected[[i+1]] = sort(update_diffusers(infected[[i]]))
  cat(length(infected[[i+1]]), "\n")
  i = i + 1
}
先看看S曲线吧:
# "growth_curve"
num_cum = unlist(lapply(1:i, function(x) length(infected[x]) ))
p_cum = num_cum/max(num_cum)
time = 1:i

png(file = "./temporal_growth_curve.png",
	width=5, height=5,
	units="in", res=300)
plot(p_cum~time, type = "b")
dev.off()

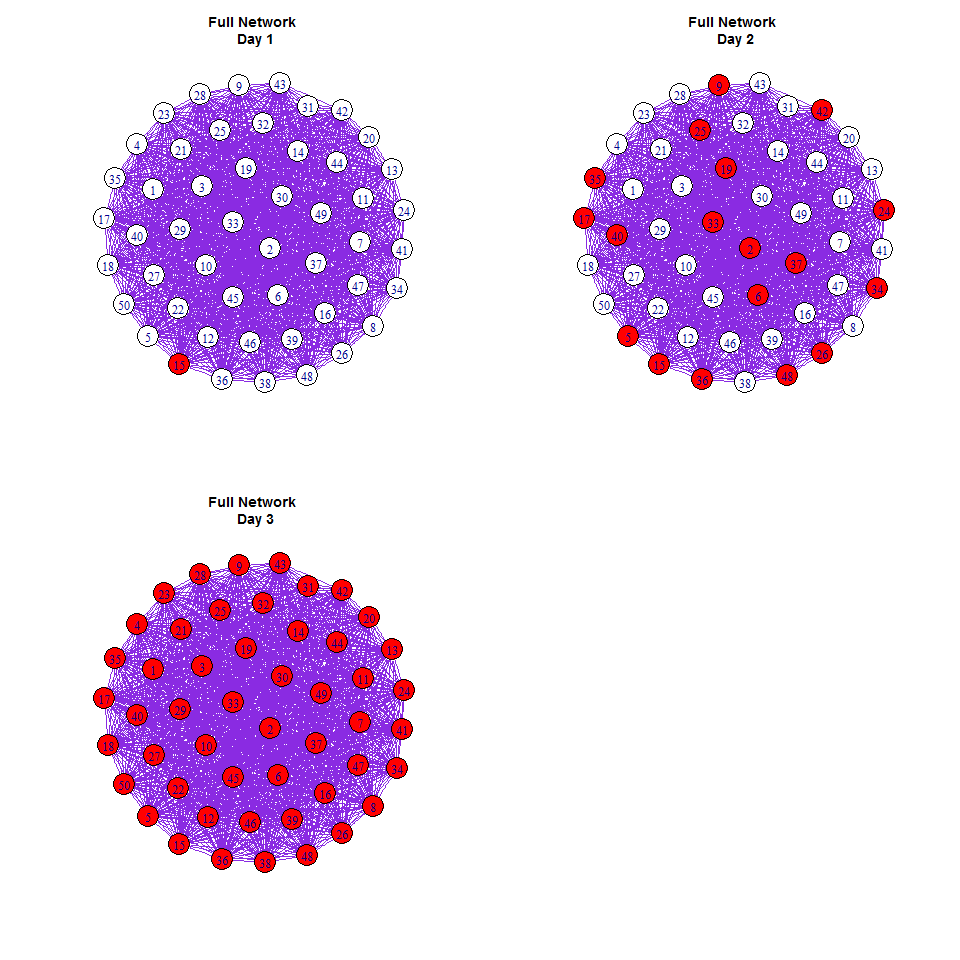
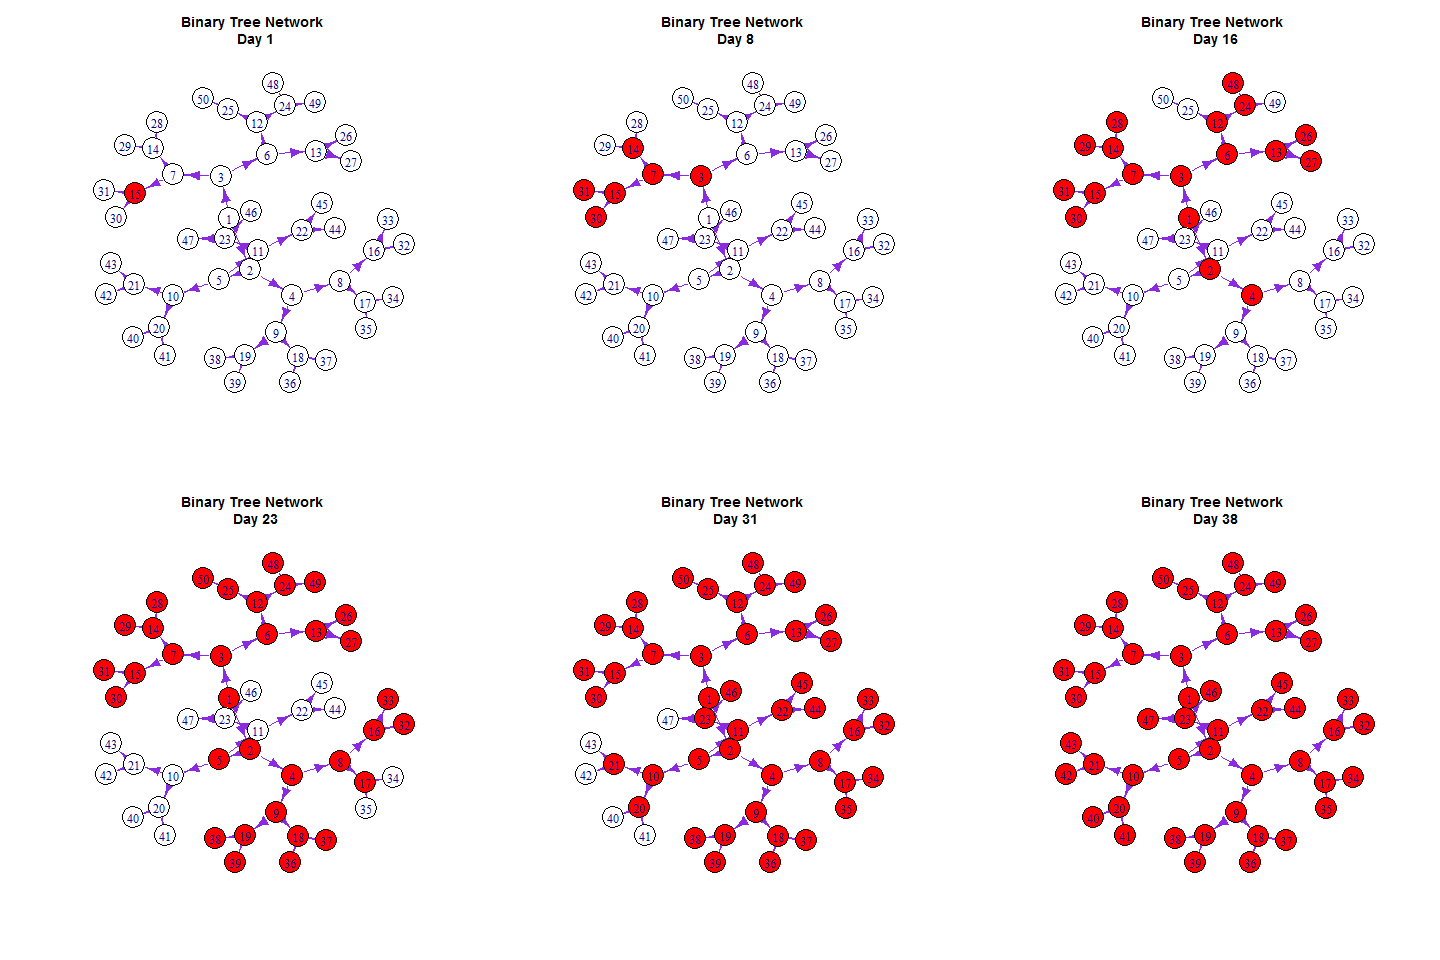
为了可视化这个扩散的过程,我们用红色来标记被感染者。
# generate a palette
E(g)$color = "blueviolet"
V(g)$color = "white"
set.seed(2014); layout.old = layout.fruchterman.reingold(g)
V(g)$color[V(g)%in%diffusers] = "red"
plot(g, layout =layout.old)
使用谢益辉开发的animation的R包可视化。
library(animation)

saveGIF({
  ani.options(interval = 0.5, convert = shQuote("C:/Program Files/ImageMagick-6.8.8-Q16/convert.exe"))
  # start the plot
  m = 1
  while(m <= length(infected)){
	V(g)$color = "white"
	V(g)$color[V(g)%in%infected[[m]]] = "red"
	plot(g, layout =layout.old)
	m = m + 1}
})


如同在Netlogo里一样,我们可以把网络扩散与增长曲线同时展示出来:
saveGIF({
  ani.options(interval = 0.5, convert = shQuote("C:/Program Files/ImageMagick-6.8.8-Q16/convert.exe"))
  # start the plot
  m = 1
  while(m <= length(infected)){
	# start the plot
	layout(matrix(c(1, 2, 1, 3), 2,2, byrow = TRUE), widths=c(3,1), heights=c(1, 1))
	V(g)$color = "white"
	V(g)$color[V(g)%in%infected[[m]]] = "red"
	num_cum = unlist(lapply(1:m, function(x) length(infected[[x]]) ))
	p_cum = num_cum/size
	p = diff(c(0, p_cum))
	time = 1:m
	plot(g, layout =layout.old, edge.arrow.size=0.2)
	title(paste("Scale-free Network \n Day", m))
	plot(p_cum~time, type = "b", ylab = "CDF", xlab = "Time",
		 xlim = c(0,i), ylim =c(0,1))
	plot(p~time, type = "h", ylab = "PDF", xlab = "Time",
		 xlim = c(0,i), ylim =c(0,1), frame.plot = FALSE)
	m = m + 1}
}, ani.width = 800, ani.height = 500)


Leave a Comment