
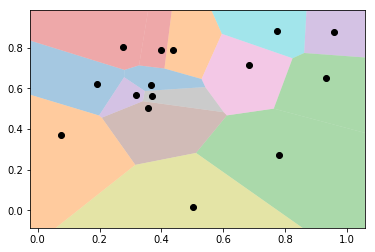
Voronoi图,又叫泰森多边形或Dirichlet图,它是由一组由连接两邻点直线的垂直平分线组成的连续多边形组成。N个在平面上有区别的点,按照最邻近原则划分平面;每个点与它的最近邻区域相关联。
本文介绍Emden Gansner, Yifan Hu, Stephen Kobourov三人所发展的GMap方法,将网络采用地图的形式进行可视化。1
GMap as an algorithm for visualizing clusters and relations has been adopted in Graphviz. Check this example.
import os
import sys
import pylab as plt
import random
import numpy as np
from scipy.spatial import Voronoi
import networkx as nx
import matplotlib.cm as cm
import matplotlib.patches as patches

%matplotlib inline
def voronoi_finite_polygons_2d(vor, radius=None):
    """
    Reconstruct infinite voronoi regions in a 2D diagram to finite
    regions.

    Parameters
    ----------
    vor : Voronoi
        Input diagram
    radius : float, optional
        Distance to 'points at infinity'.

    Returns
    -------
    regions : list of tuples
        Indices of vertices in each revised Voronoi regions.
    vertices : list of tuples
        Coordinates for revised Voronoi vertices. Same as coordinates
        of input vertices, with 'points at infinity' appended to the
        end.

    """

    if vor.points.shape[1] != 2:
        raise ValueError("Requires 2D input")

    new_regions = []
    new_vertices = vor.vertices.tolist()

    center = vor.points.mean(axis=0)
    if radius is None:
        radius = vor.points.ptp().max()

    # Construct a map containing all ridges for a given point
    all_ridges = {}
    for (p1, p2), (v1, v2) in zip(vor.ridge_points, vor.ridge_vertices):
        all_ridges.setdefault(p1, []).append((p2, v1, v2))
        all_ridges.setdefault(p2, []).append((p1, v1, v2))

    # Reconstruct infinite regions
    for p1, region in enumerate(vor.point_region):
        vertices = vor.regions[region]

        if all(v >= 0 for v in vertices):
            # finite region
            new_regions.append(vertices)
            continue

        # reconstruct a non-finite region
        ridges = all_ridges[p1]
        new_region = [v for v in vertices if v >= 0]

        for p2, v1, v2 in ridges:
            if v2 < 0:
                v1, v2 = v2, v1
            if v1 >= 0:
                # finite ridge: already in the region
                continue

            # Compute the missing endpoint of an infinite ridge

            t = vor.points[p2] - vor.points[p1] # tangent
            t /= np.linalg.norm(t)
            n = np.array([-t[1], t[0]])  # normal

            midpoint = vor.points[[p1, p2]].mean(axis=0)
            direction = np.sign(np.dot(midpoint - center, n)) * n
            far_point = vor.vertices[v2] + direction * radius

            new_region.append(len(new_vertices))
            new_vertices.append(far_point.tolist())

        # sort region counterclockwise
        vs = np.asarray([new_vertices[v] for v in new_region])
        c = vs.mean(axis=0)
        angles = np.arctan2(vs[:,1] - c[1], vs[:,0] - c[0])
        new_region = np.array(new_region)[np.argsort(angles)]

        # finish
        new_regions.append(new_region.tolist())

    return new_regions, np.asarray(new_vertices)
# make up data points
np.random.seed(1234)
points = np.random.rand(15, 2)
vor = Voronoi(points)
# colorize
regions, vertices = voronoi_finite_polygons_2d(vor)
for region in regions:
    polygon = vertices[region]
    plt.fill(*zip(*polygon), alpha=0.4)
plt.plot(points[:,0], points[:,1], 'ko')
plt.xlim(vor.min_bound[0] - 0.1, vor.max_bound[0] + 0.1)
plt.ylim(vor.min_bound[1] - 0.1, vor.max_bound[1] + 0.1)
plt.show()
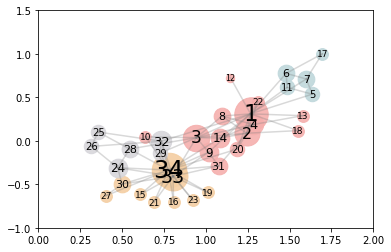
G=nx.karate_club_graph()
#pos=nx.spring_layout(G)
G=nx.relabel_nodes(G,dict((i,i+1) for i in G.nodes()))
cluster={
    0:[1,2,3,4,8,9,10,12,13,14,18,20,22,31],
    1:[15,16,19,21,23,27,30,33,34],
    2:[24,25,26,28,29,32],#
    3:[5,6,7,11,17]#
}
pos = {1: [1.2671267378014635, 0.3102177140418711],
 2: [1.2440140690758723, 0.0873235260776201],
 3: [0.9432900573614391, 0.0366289377358215],
 4: [1.2839881803522586, 0.18775705721406266],
 5: [1.6356625496920887, 0.5364304874683598],
 6: [1.479711805329051, 0.7757720824924772],
 7: [1.600153077856815, 0.7107440212514635],
 8: [1.0960830734460576, 0.2842855479626049],
 9: [1.016519378275057, -0.13097428785642726],
 10: [0.639272865907841, 0.045273275047621825],
 11: [1.4856220155900275, 0.6137091481304446],
 12: [1.1467656587393191, 0.7260642156314318],
 13: [1.578713496504133, 0.28897920996543175],
 14: [1.0866076613602083, 0.0324891306027731],
 15: [0.6095087654957319, -0.6167461215046663],
 16: [0.8073300743205015, -0.7032532624319141],
 17: [1.695234935185134, 1.0],
 18: [1.5508730752239885, 0.11739977455592167],
 19: [1.0122842196452817, -0.5939813064541476],
 20: [1.1878838189811682, -0.09472629705447132],
 21: [0.6903437483530793, -0.7054992503355051],
 22: [1.3096795308668305, 0.4486558399509583],
 23: [0.9216927787343814, -0.6811603880396495],
 24: [0.473095153961141, -0.30902901663011617],
 25: [0.3566860688039907, 0.10115982012585126],
 26: [0.3165513729295031, -0.06403308564232803],
 27: [0.4021746940032246, -0.6319874241813408],
 28: [0.5448939262199529, -0.09419216923213751],
 29: [0.7275165750759496, -0.14103922572351701],
 30: [0.5000084086307361, -0.49721813995004793],
 31: [1.0756055912941322, -0.28945672530528466],
 32: [0.7342732166633892, -0.004817640113753714],
 33: [0.8036843668459267, -0.4087090522614389],
 34: [0.777149051474323, -0.3360663955379709]}
nodeClusterLabel = dict((j, k) for k, v in cluster.items() for j in v)
allPoints=pos # allPoints to include other types in future
vor = Voronoi(list(allPoints.values()))
regions, vertices = voronoi_finite_polygons_2d(vor)

Regions = dict(zip(allPoints.keys(), regions))
Vertices = dict(zip(range(len(vertices)), vertices))
cp={0:'#F5AFAD',1:'#F4CEA2',2:'#D7D6DB',3:'#BFD7DB'}
for j in nodeClusterLabel:
    x,y=pos[j]
    plt.scatter(x,y,s=G.degree[j]*70,color=cp[label[j]],alpha=0.9)
    plt.text(x,y,str(j),fontsize=G.degree[j]+7,va='center',ha='center')
for i,j in G.edges():
    x1,y1=pos[i]
    x2,y2=pos[j]
    plt.plot([x1,x2],[y1,y2],color='gray',alpha=0.3)

plt.xlim(0,2)
plt.ylim(-1,1.5)

plt.show()
cp={0:'#F5AFAD',1:'#F4CEA2',2:'#D7D6DB',3:'#BFD7DB'}
for j in nodeClusterLabel:
x,y=pos[j]
#plt.scatter(x,y,s=G.degree[j]*70,color=cp[label[j]],alpha=0.9)
plt.text(x,y,str(j),fontsize=G.degree[j]+7,va='center',ha='center')
for i,j in G.edges():
x1,y1=pos[i]
x2,y2=pos[j]
plt.plot([x1,x2],[y1,y2],color='gray',alpha=0.3)
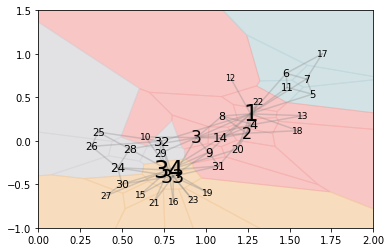
for i in Regions:
polygon = np.array([Vertices[j] for j in Regions[i]])
plt.fill(*zip(*polygon), alpha=0.7,color=cp[nodeClusterLabel[i]])
plt.xlim(0,2)
plt.ylim(-1,1.5)
plt.show()
# generate dots on the edge
r=0.14;N=1000
xmin,xmax=np.array([0,2])
ymin,ymax=np.array([-1,1.5])
xmax+=r; xmin-=r
ymax+=r; ymin-=r
a = np.random.uniform(xmin,xmax, size = (N, 1))
b = np.random.uniform(ymin,ymax, size = (N, 1))
t = np.hstack([a, b] )
mins = np.array([min([np.linalg.norm(i-j) for j in pos.values()]) for i in t])
t = t[mins >r]

surroundPoints = dict(('surround'+str(n), list(k)) for n, k in enumerate(t))
allPoints1 = allPoints.copy()
allPoints1.update(surroundPoints)
regions1, vertices1 = voronoi_finite_polygons_2d(Voronoi(list(allPoints1.values())))
Regions1 = dict(zip(allPoints1.keys(), regions1))
Vertices1 = dict(zip(range(len(vertices1)), vertices1))
fig = plt.figure(figsize=(10, 10),facecolor='white')

for j in label:
    x,y=pos[j]
    plt.text(x,y,str(j),fontsize=G.degree[j]+7,va='center',ha='center')
for i,j in G.edges():
    x1,y1=pos[i]
    x2,y2=pos[j]
    plt.plot([x1,x2],[y1,y2],color='gray',alpha=0.3)
for i in Regions1:
    polygon = np.array([Vertices1[j] for j in Regions1[i]])
    if 'surround'  in str(i):
        plt.fill(*zip(*polygon), alpha=0.7,color='SteelBlue')
    else:
        plt.fill(*zip(*polygon), alpha=0.7,color=cp[nodeClusterLabel[i]])
x, y=np.array(list(surroundPoints.values())).T
plt.scatter(x,y,facecolor='g',edgecolor='',s=5)
plt.xlim(0,2)
plt.ylim(-1,1.5)
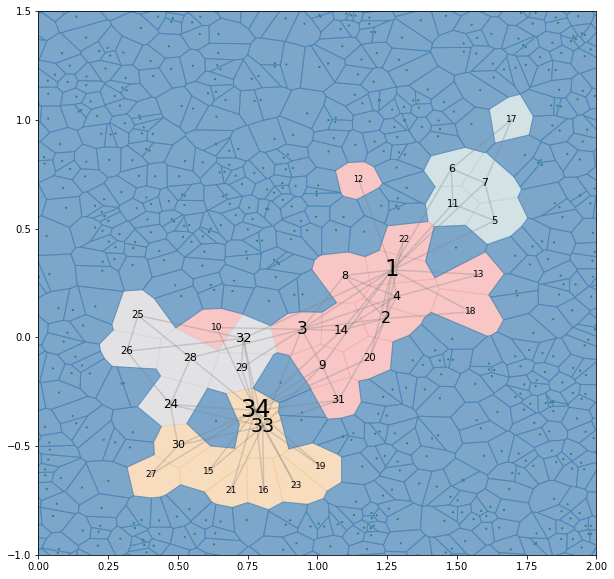
# generate rectangle-shape points around nodes
n=3
rectPoints={}
rectPointsClusters = {}
m = 0
for i in pos:
    x,y=pos[i]
    k=G.degree[i]
    l=k/100.0+0.02
    xs=np.random.uniform(x-l,x+l,n)
    ys=np.random.uniform(y-l,y+l,n)
    cos=list(zip(list(xs)+list(xs),[y-l]*n+[y+l]*n)) + list(zip([x-l]*n+[x+l]*n,list(ys)+list(ys)))
    for p in cos:
        rectPoints['rect'+ str(m)]=p
        rectPointsClusters['rect'+ str(m)] = nodeClusterLabel[i]
        m+=1

allPoints2 = allPoints1.copy()
allPoints2.update(rectPoints)
regions2, vertices2 = voronoi_finite_polygons_2d(Voronoi(list(allPoints2.values())))
Regions2 = dict(zip(allPoints2.keys(), regions2))
Vertices2 = dict(zip(range(len(vertices2)), vertices2))
fig = plt.figure(figsize=(10, 10),facecolor='white')

for j in label:
    x,y=pos[j]
    plt.text(x,y,str(j),fontsize=G.degree[j]+7,va='center',ha='center')
for i,j in G.edges():
    x1,y1=pos[i]
    x2,y2=pos[j]
    plt.plot([x1,x2],[y1,y2],color='gray',alpha=0.3)
for i in Regions2:
    polygon = np.array([Vertices2[j] for j in Regions2[i]])
    if 'surround' in str(i):
        plt.fill(*zip(*polygon), alpha=0.7,facecolor='SteelBlue', edgecolor = None) #  'SteelBlue'
        #plt.fill(*zip(*polygon), alpha=0.7,facecolor=None, edgecolor = 'SteelBlue') #  'SteelBlue'

    elif 'rect' in str(i):
        plt.fill(*zip(*polygon), alpha=0.7,color=cp[rectPointsClusters[i]])
    else:
        plt.fill(*zip(*polygon), alpha=0.7,color=cp[nodeClusterLabel[i]])

# plt.scatter(rs[:,0],rs[:,1],s=3)
x, y=np.array(list(surroundPoints.values())).T
plt.scatter(x,y,facecolor='g',edgecolor='',s=5)

x, y=np.array(list(rectPoints.values())).T
plt.scatter(x,y,facecolor='k',edgecolor='',s=5)
plt.xlim(0,2)
plt.ylim(-1,1.5)
plt.show()
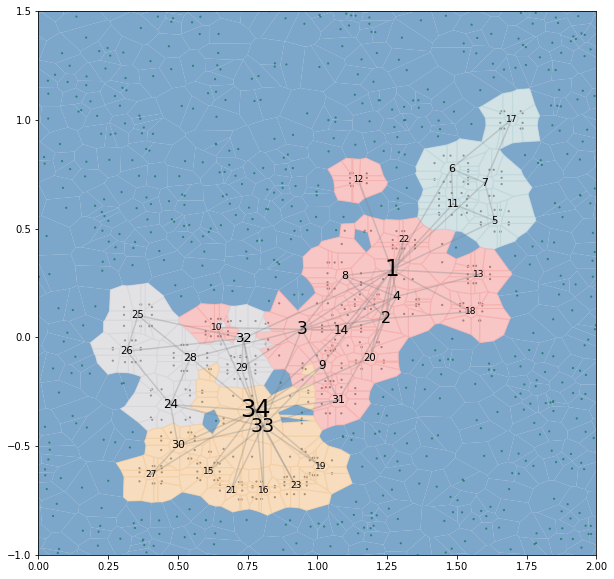
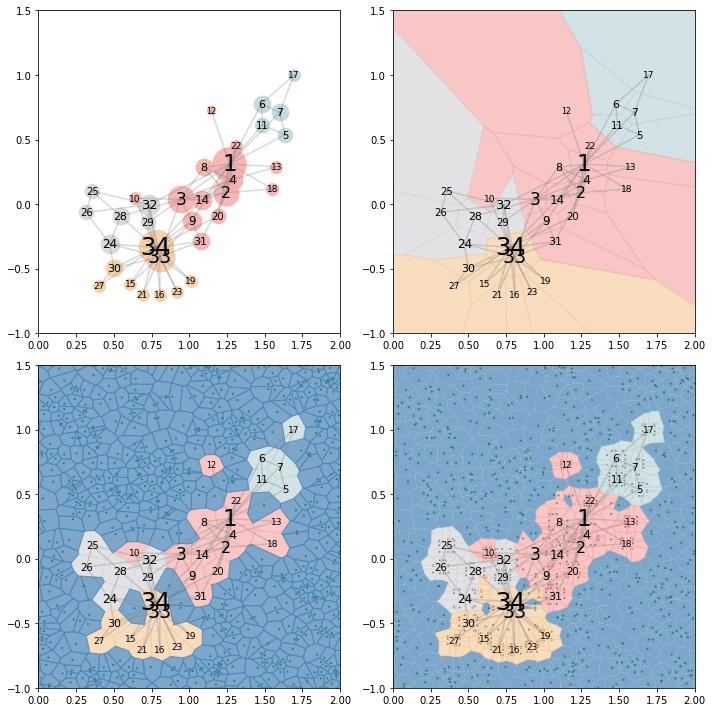
fig = plt.figure(figsize=(10, 10),facecolor='white')
ax = fig.add_subplot(221)
#cmap = cm.get_cmap('rainbow',4)
cp={0:'#F5AFAD',1:'#F4CEA2',2:'#D7D6DB',3:'#BFD7DB'}
for j in nodeClusterLabel:
    x,y=pos[j]
    plt.scatter(x,y,s=G.degree[j]*70,color=cp[label[j]],alpha=0.9)
    plt.text(x,y,str(j),fontsize=G.degree[j]+7,va='center',ha='center')
for i,j in G.edges():
    x1,y1=pos[i]
    x2,y2=pos[j]
    plt.plot([x1,x2],[y1,y2],color='gray',alpha=0.3)
plt.xlim(0,2)
plt.ylim(-1,1.5)
#
ax = fig.add_subplot(222)
#cmap = cm.get_cmap('rainbow',4)
cp={0:'#F5AFAD',1:'#F4CEA2',2:'#D7D6DB',3:'#BFD7DB'}
for j in nodeClusterLabel:
    x,y=pos[j]
    #plt.scatter(x,y,s=G.degree[j]*70,color=cp[label[j]],alpha=0.9)
    plt.text(x,y,str(j),fontsize=G.degree[j]+7,va='center',ha='center')
for i,j in G.edges():
    x1,y1=pos[i]
    x2,y2=pos[j]
    plt.plot([x1,x2],[y1,y2],color='gray',alpha=0.3)
for i in Regions:
    polygon = np.array([Vertices[j] for j in Regions[i]])
    plt.fill(*zip(*polygon), alpha=0.7,color=cp[nodeClusterLabel[i]])
plt.xlim(0,2)
plt.ylim(-1,1.5)
#plt.xlim(vor.min_bound[0] - 0.1, vor.max_bound[0] + 0.1)
#plt.ylim(vor.min_bound[1] - 0.1, vor.max_bound[1] + 0.1)
#
ax = fig.add_subplot(223)
for j in label:
    x,y=pos[j]
    plt.text(x,y,str(j),fontsize=G.degree[j]+7,va='center',ha='center')
for i,j in G.edges():
    x1,y1=pos[i]
    x2,y2=pos[j]
    plt.plot([x1,x2],[y1,y2],color='gray',alpha=0.3)
for i in Regions1:
    polygon = np.array([Vertices1[j] for j in Regions1[i]])
    if 'surround'  in str(i):
        plt.fill(*zip(*polygon), alpha=0.7,color='SteelBlue')
    else:
        plt.fill(*zip(*polygon), alpha=0.7,color=cp[nodeClusterLabel[i]])
x, y=np.array(list(surroundPoints.values())).T
plt.scatter(x,y,facecolor='g',edgecolor='',s=5)
plt.xlim(0,2)
plt.ylim(-1,1.5)
#
ax = fig.add_subplot(224)
for j in label:
    x,y=pos[j]
    plt.text(x,y,str(j),fontsize=G.degree[j]+7,va='center',ha='center')
for i,j in G.edges():
    x1,y1=pos[i]
    x2,y2=pos[j]
    plt.plot([x1,x2],[y1,y2],color='gray',alpha=0.3)
for i in Regions2:
    polygon = np.array([Vertices2[j] for j in Regions2[i]])
    if 'surround' in str(i):
        plt.fill(*zip(*polygon), alpha=0.7,facecolor='SteelBlue', edgecolor = None) #  'SteelBlue'
        #plt.fill(*zip(*polygon), alpha=0.7,facecolor=None, edgecolor = 'SteelBlue') #  'SteelBlue'

    elif 'rect' in str(i):
        plt.fill(*zip(*polygon), alpha=0.7,color=cp[rectPointsClusters[i]])
    else:
        plt.fill(*zip(*polygon), alpha=0.7,color=cp[nodeClusterLabel[i]])

# plt.scatter(rs[:,0],rs[:,1],s=3)
x, y=np.array(list(surroundPoints.values())).T
plt.scatter(x,y,facecolor='g',edgecolor='',s=5)

x, y=np.array(list(rectPoints.values())).T
plt.scatter(x,y,facecolor='k',edgecolor='',s=5)
plt.xlim(0,2)
plt.ylim(-1,1.5)
#
plt.tight_layout()
plt.show()
Reference
-
Emden Gansner, Yifan Hu, Stephen Kobourov, GMap: Visualizing Graphs and Clusters as Maps https://www2.cs.arizona.edu/~kobourov/pacvis10.pdf ↩


Leave a Comment