
%matplotlib inline
import matplotlib.pyplot as plt
import pandas as pd
import seaborn as sns
print(plt.style.available)
['seaborn-dark', 'seaborn-darkgrid', 'seaborn-ticks', 'fivethirtyeight', 'seaborn-whitegrid', 'classic', 'seaborn-talk', 'seaborn-dark-palette', 'seaborn-bright', 'seaborn-pastel', 'grayscale', 'seaborn-notebook', 'ggplot', 'seaborn-colorblind', 'seaborn-muted', 'seaborn-paper', 'bmh', 'seaborn-white', 'dark_background', 'seaborn-poster', 'seaborn-deep']
sns.set_style("whitegrid")
plt.style.use('seaborn-whitegrid')
# https://www.theguardian.com/world/datablog/2010/jul/26/wikileaks-afghanistan-ied-attacks
# or https://pan.baidu.com/s/1jKjBXOy
df = pd.read_excel('../data/wikileaks/ExplodedIED.xls')
df.head()
WARNING *** file size (8971777) not 512 + multiple of sector size (512)
| ReportKey | DateOccurred | Type | Category | TrackingNumber | Title | Summary | Region | AttackOn | ComplexAttack | ... | EnemyDetained | MGRS | Latitude | Longitude | OriginatorGroup | UpdatedByGroup | CCIR | Sigact | Affiliation | DColor | |
|---|---|---|---|---|---|---|---|---|---|---|---|---|---|---|---|---|---|---|---|---|---|
| 0 | 7AEE1FD6-488D-4351-A7DC-16A627ACDE9A | 2004-01-04 00:00:00 | Explosive Hazard | IED Explosion | 2007-033-005354-0981 | (EXPLOSIVE HAZARD) IED EXPLOSION RPT (VBIED) ... | 04 JAN: AT LEAST 15 DEAD IN TRUCK BOMB ATTACK ... | RC SOUTH | ENEMY | 0.0 | ... | 0.0 | 41RQQ6257932849 | 31.000000 | 65.749992 | UNKNOWN | JTF Paladin 3rd EOD BN S-3 | NaN | NaN | ENEMY | RED |
| 1 | 99AA5C2F-2129-4200-AB73-AA29D94E0D83 | 2004-01-06 00:00:00 | Explosive Hazard | IED Explosion | 2007-033-005356-0059 | (EXPLOSIVE HAZARD) IED EXPLOSION RPT (UNK) OT... | EXPLOSION KILLS 50 NEAR QABA MOSQUE IN SPIN BO... | RC SOUTH | ENEMY | 0.0 | ... | 0.0 | 42RTV5174832504 | 31.000000 | 66.400002 | UNKNOWN | JTF Paladin 3rd EOD BN S-3 | NaN | NaN | ENEMY | RED |
| 2 | F0E77B28-FDB5-44A4-ABC1-1D21052AA981 | 2004-01-06 00:00:00 | Explosive Hazard | IED Explosion | 2007-033-005356-0169 | (EXPLOSIVE HAZARD) IED EXPLOSION RPT (UNK) OT... | ATTACK BY ACM IN QALAT KILLED 27TH DIV. CMD. A... | RC SOUTH | ENEMY | 0.0 | ... | 0.0 | 42SUA0184053450 | 32.099991 | 66.900002 | UNKNOWN | JTF Paladin 3rd EOD BN S-3 | NaN | NaN | ENEMY | RED |
| 3 | D61E2F11-3079-4C5B-A37F-23EA50DCBA31 | 2004-01-25 00:00:00 | Explosive Hazard | IED Explosion | 2007-033-005407-0968 | (EXPLOSIVE HAZARD) IED EXPLOSION RPT (UNK) US... | CJSOTF-A REPORTS USMC PATROL AMBUSHED IVO 42SX... | RC EAST | ENEMY | 1.0 | ... | 0.0 | 42SXD9410056091 | 34.828609 | 71.122498 | UNKNOWN | J3 ORSA | NaN | NaN | ENEMY | RED |
| 4 | 6B9D2340-1AA2-418A-BFA6-F2F953E52FC5 | 2004-01-26 00:00:00 | Explosive Hazard | IED Explosion | 2007-033-005353-0543 | IED CF Other 2 CF WIA | (S//REL GCTF) CJSOTF-A REPORTS IED STRIKE FOLL... | RC EAST | ENEMY | 0.0 | ... | 0.0 | 42SXD9431252088 | 34.792500 | 71.123894 | UNKNOWN | UNKNOWN | NaN | NaN | ENEMY | RED |
5 rows × 31 columns
len(df)
7527
df['time'] = [str(i)[:8]+'01' for i in df.DateOccurred]
df['time'] = [i if '200' in i else np.nan for i in df.time  ]
df['time'] = pd.to_datetime(df.time, format = '%Y-%m-%d')
df['year'] = [str(i)[:4] for i in df.DateOccurred]
df['year'] = [int(i) if '200' in i else np.nan for i in df.year]
df = df.dropna(subset = ['Latitude','Longitude'])
len(df)
7346
df.columns
Index(['ReportKey', 'DateOccurred', 'Type', 'Category', 'TrackingNumber',
       'Title', 'Summary', 'Region', 'AttackOn', 'ComplexAttack',
       'ReportingUnit', 'UnitName', 'TypeOfUnit', 'FriendlyWIA', 'FriendlyKIA',
       'HostNationWIA', 'HostNationKIA', 'CivilianWIA', 'CivilianKIA',
       'EnemyWIA', 'EnemyKIA', 'EnemyDetained', 'MGRS', 'Latitude',
       'Longitude', 'OriginatorGroup', 'UpdatedByGroup', 'CCIR', 'Sigact',
       'Affiliation', 'DColor', 'time', 'year'],
      dtype='object')
df.iloc[0]
ReportKey                       7AEE1FD6-488D-4351-A7DC-16A627ACDE9A
DateOccurred                                     2004-01-04 00:00:00
Type                                                Explosive Hazard
Category                                               IED Explosion
TrackingNumber                                  2007-033-005354-0981
Title              (EXPLOSIVE HAZARD) IED EXPLOSION RPT  (VBIED) ...
Summary            04 JAN: AT LEAST 15 DEAD IN TRUCK BOMB ATTACK ...
Region                                                      RC SOUTH
AttackOn                                                       ENEMY
ComplexAttack                                                      0
ReportingUnit                                                  OTHER
UnitName                                                       OTHER
TypeOfUnit                                             None Selected
FriendlyWIA                                                        0
FriendlyKIA                                                        0
HostNationWIA                                                      0
HostNationKIA                                                      0
CivilianWIA                                                        0
CivilianKIA                                                        0
EnemyWIA                                                           0
EnemyKIA                                                           0
EnemyDetained                                                      0
MGRS                                                 41RQQ6257932849
Latitude                                                          31
Longitude                                                      65.75
OriginatorGroup                                              UNKNOWN
UpdatedByGroup                            JTF Paladin 3rd EOD BN S-3
CCIR                                                             NaN
Sigact                                                           NaN
Affiliation                                                    ENEMY
DColor                                                           RED
Name: 0, dtype: object
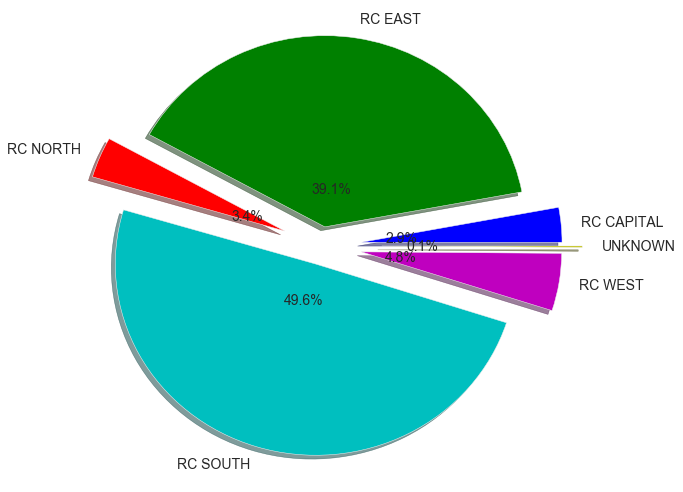
plt.figure(figsize = (8, 8))
region_freq = df.groupby('Region').size()
explode = (0.2, 0.1, 0.2, 0.1, 0.2, 0.3)  # only "explode" the 2nd slice (i.e. 'Hogs')
plt.pie(region_freq, labels = region_freq.index, explode = explode,
        autopct='%0.1f%%',
        pctdistance=0.2, shadow=True)
plt.show()
df.Type.value_counts()
Explosive Hazard    7344
Enemy Action           2
Name: Type, dtype: int64
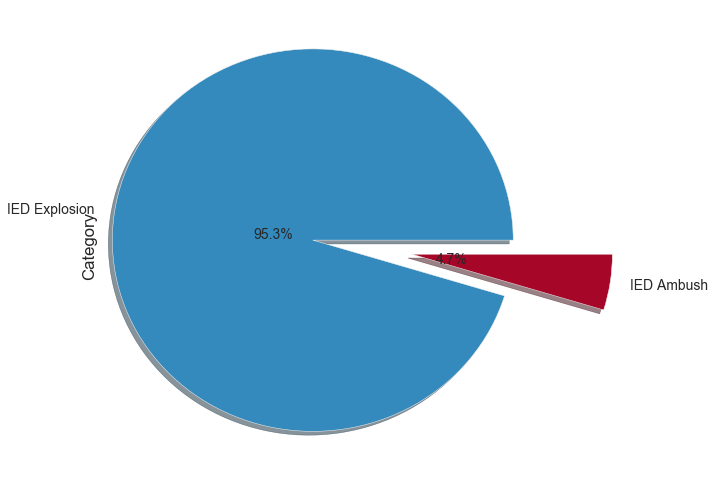
plt.figure(figsize = (8, 8))
explode = (0.2, 0.3)

df.Category.value_counts().plot(kind='pie', explode = explode,
        autopct='%0.1f%%',
        pctdistance=0.2, shadow=True)
plt.show()
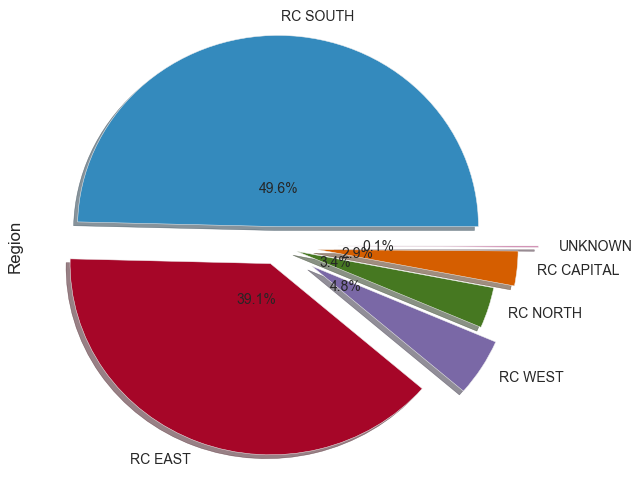
plt.figure(figsize = (8, 8))
explode = (0.1, 0.1, 0.2, 0.1, 0.2, 0.3)

df.Region.value_counts().plot(kind='pie', explode = explode,
        autopct='%0.1f%%',
        pctdistance=0.2, shadow=True)
plt.show()
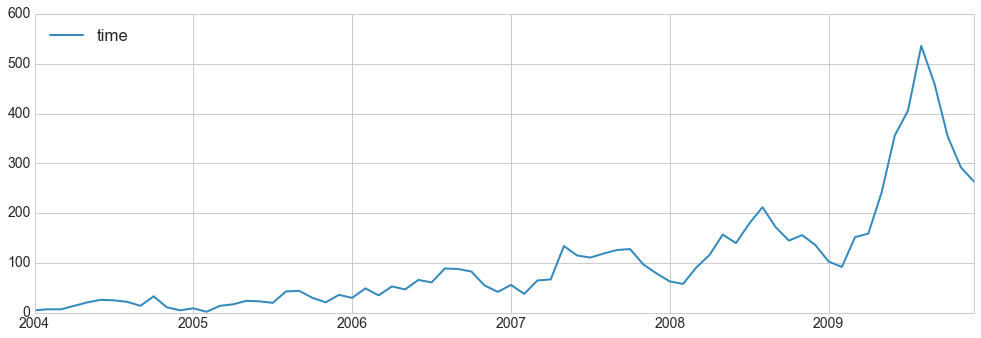
import numpy as np
d = df.time.value_counts()
dd = pd.DataFrame(d)
dd = dd.sort_index(axis=0, ascending=True)

dd.plot(figsize = (15,5))
plt.show()
import folium #, jinja2, vincent
from folium import plugins
from IPython.display import IFrame
from IPython.core.display import HTML
print(folium.__file__)
print(folium.__version__)
/Users/chengjun/anaconda3/lib/python3.6/site-packages/folium/__init__.py
0.5.0
nodes = [(df.Latitude[i], df.Longitude[i]) for i in df.index]
map_osm = folium.Map(location=[df.Latitude.mean(), df.Longitude.mean() ], tiles = 'cartodbpositron',
                     #tiles='stamentoner',
                     zoom_start=5.4)
map_osm.add_child(plugins.HeatMap(nodes))
map_osm.fit_bounds(map_osm.get_bounds())
map_osm
def year_map(year):
    map_osm = folium.Map(location=[df.Latitude.mean(), df.Longitude.mean() ], tiles = 'cartodbpositron',
                         #tiles='stamentoner',
                         zoom_start=5.4)


    locations = [(df.Latitude[i], df.Longitude[i]) for i in df[df.year == year].index]

    # locations = nodes
    # popups = ['{}'.format(loc) for loc in locations]

    for coord in locations:
        folium.CircleMarker( location=[ coord[0], coord[1] ] ,
                            radius=1,
                            color = 'red',
                            fill_color='red',
                            weight=.5).add_to( map_osm )

    #Set the zoom to the maximum possible
    map_osm.fit_bounds(map_osm.get_bounds())
    return map_osm
for year in df.year.unique():
    map_osm = year_map(year)
    map_osm.save('../vis/Wikileaks_Afghanistan_Year_' + str(year)+ '.html')
map2004 = year_map(2004)
map2005 = year_map(2005)
map2004
map2005
import geopandas as gpd
# Read file using gpd.read_file()
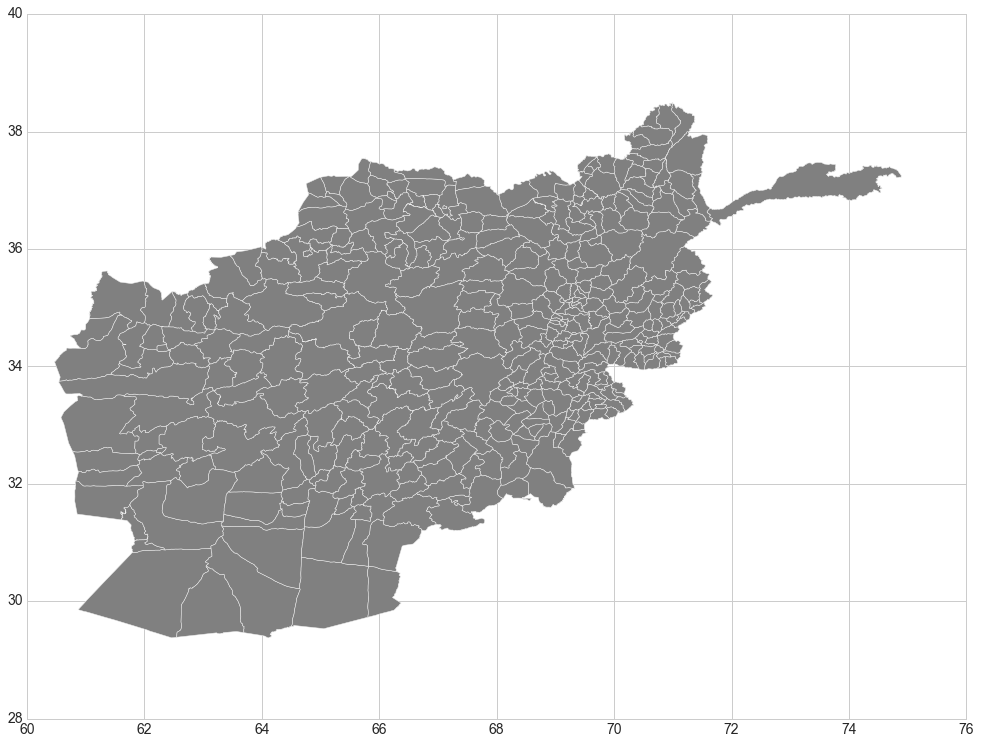
country = gpd.GeoDataFrame.from_file('../data/afghanistan_district398.shp')
country.to_crs()
{}
places.crs
{'init': 'epsg:4326'}
country.plot(figsize = (15, 15), color = 'grey')
plt.show()
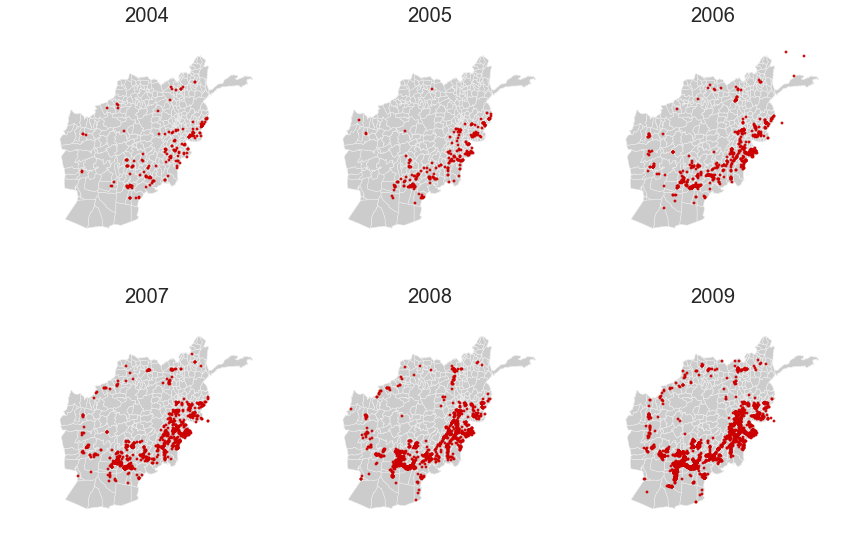
def plot_points_on_shapefile(year, ax):
    from shapely.geometry import Point
    import geopandas as gpd
    country = gpd.GeoDataFrame.from_file('../data/afghanistan_district398.shp')
    # https://esoc.princeton.edu/files/administrative-boundaries-398-districts
    # Create a DataFrame with some cities, including their location
    places = df[['TrackingNumber', 'Latitude', 'Longitude', 'year']][df.year == year]

    # Create the geometry column from the coordinates
    # Remember that longitude is east-west (i.e. X) and latitude is north-south (i.e. Y)
    places["geometry"] = places.apply(lambda row: Point(row["Longitude"], row["Latitude"]), axis=1)
    del(places["Latitude"], places["Longitude"], places["year"] )

    # # Convert to a GeoDataFrame
    places = gpd.GeoDataFrame(places, geometry="geometry")

    # # Declare the coordinate system for the places GeoDataFrame
    # # GeoPandas doesn't do any transformations automatically when performing
    # # the spatial join. The layers are already in the same CRS (WGS84) so no
    # # transformation is needed.
    places.crs = {"init": "epsg:4326"}
    country.crs = {"init": "epsg:4326"}

    # Perform the spatial join
    #result = gpd.tools.sjoin(places, country, how="left")
    country.plot(ax=ax, color="#cccccc")
    places.plot(ax=ax, markersize=5, color="#cc0000")
    plt.axis('off')
    plt.title(str(year))
import matplotlib.pyplot as plt
fig = plt.figure(figsize=(12, 8),facecolor='white')
year = [2004+i for i in range(6)]
for k, i in enumerate(year):
    ax = fig.add_subplot(2,3,k+1)
    plot_points_on_shapefile(i, ax)
plt.tight_layout()
# https://pan.baidu.com/s/1jKjBXOy
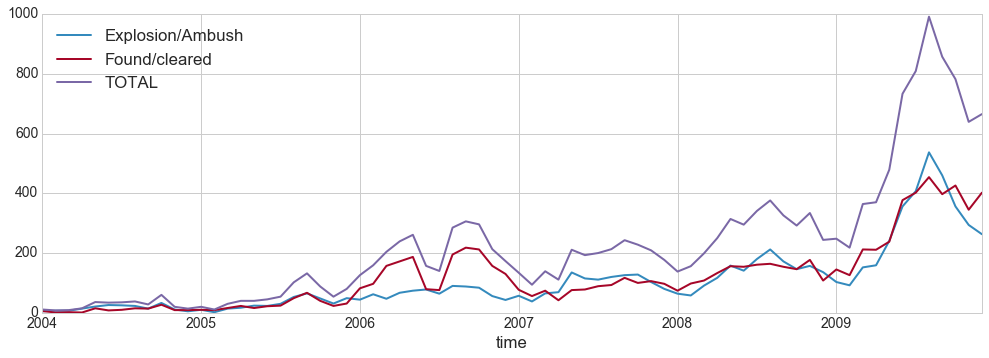
dfa = pd.read_excel('../data/wikileaks/Wikileaks Afghanistan war logs analysis.xlsx', skiprows = 1)
dfa.head()
| Year | Month | Explosion/Ambush | Found/cleared | TOTAL | Unnamed: 5 | Unnamed: 6 | Year.1 | Explosion/Ambush.1 | Found/cleared.1 | |
|---|---|---|---|---|---|---|---|---|---|---|
| 0 | 2004 | January | 5 | 6 | 11 | NaN | NaN | 2004 Total | 191 | 117.0 |
| 1 | 2004 | February | 7 | 1 | 8 | NaN | NaN | 2005 Total | 366 | 330.0 |
| 2 | 2004 | March | 7 | 2 | 9 | NaN | NaN | 2006 Total | 797 | 1762.0 |
| 3 | 2004 | April | 14 | 1 | 15 | NaN | NaN | 2007 Total | 1147 | 1005.0 |
| 4 | 2004 | May | 21 | 15 | 36 | NaN | NaN | 2008 Total | 1632 | 1633.0 |
{i:str(k+1) for k, i in enumerate(dfa.Month.unique())}
{'April': '4',
 'August': '8',
 'December': '12',
 'February': '2',
 'January': '1',
 'July': '7',
 'June': '6',
 'March': '3',
 'May': '5',
 'November': '11',
 'October': '10',
 'September': '9'}
month_dic = {'April': '04',
 'August': '08',
 'December': '12',
 'February': '02',
 'January': '01',
 'July': '07',
 'June': '06',
 'March': '03',
 'May': '05',
 'November': '11',
 'October': '10',
 'September': '09'}
# slice from the beginning to 'TOTAL'
dfa = dfa.loc[:, :'TOTAL']
dfa['month'] = [month_dic[i] for i in dfa.Month]
dfa['time'] =  [str(dfa.Year[i])+dfa.month[i]+'01' for i in dfa.index]
dfa['time'] = pd.to_datetime(dfa.time, format = '%Y%m%d')
dfa.set_index("time", inplace=True)
dfa[['Explosion/Ambush', 'Found/cleared', 'TOTAL']].plot(figsize=(15, 5))
plt.show()
更多信息见:
https://github.com/chengjun/WikileaksAfghanistanDataAnalysis
和
https://chengjunwang.com/WikileaksAfghanistanDataAnalysis/


Leave a Comment